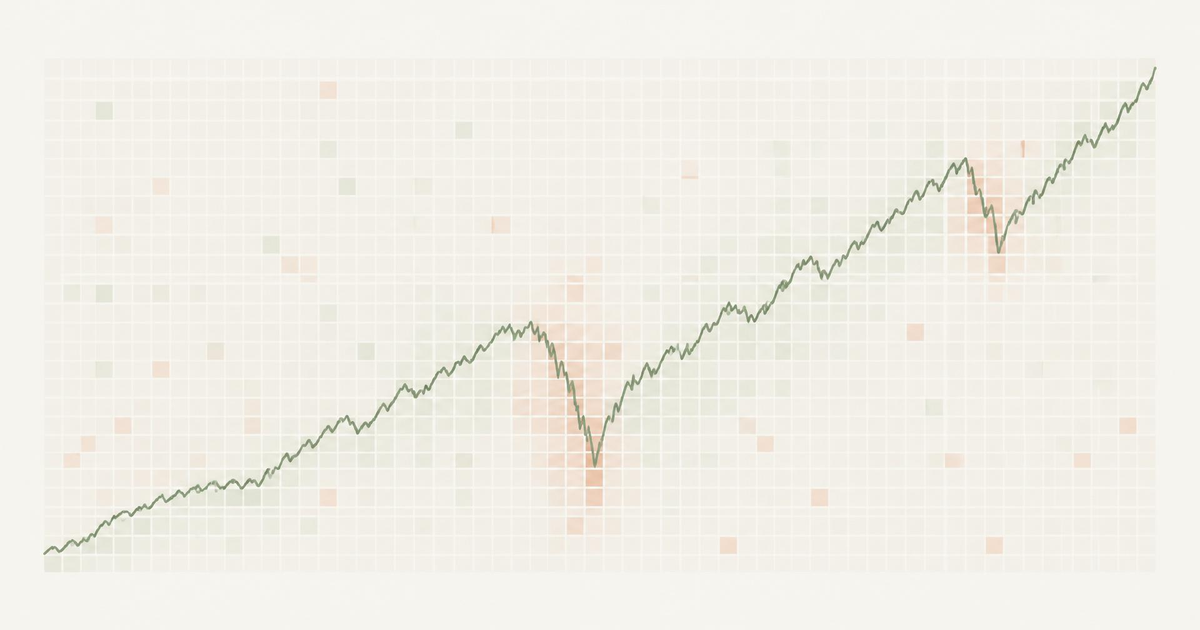
NIFTY 50 historical returns, month by month
Data through 30 Oct 2026 · NIFTY 50 closed at 23,053.10
- Annualised since January 2000
- +10.77%
- Calendar years that ended positive
- 21 of 26
- Full years only
- Best month
- +28.07%
- May 2009
- Worst month
- −26.41%
- October 2008
Point to point return
Pick any two dates. A holiday uses the last trading day before it.
Close on 30 Oct 2021 to close on 30 Oct 2026 · 1,826 days
+30.45%
- CAGR
- +5.46%
- Value today of ₹1,00,000
- ₹1,30,452
- Start level
- 17,671.65
- End level
- 23,053.10
- Deepest fall inside the period
- −16.47%
- Months up
- 32 of 60
Drag across the chart to set both dates.
Month-wise and year-wise returns
Tap one month, then another, to measure the return between them in the calculator.
| Year | Jan | Feb | Mar | Apr | May | Jun | Jul | Aug | Sep | Oct | Nov | Dec | Annual |
|---|---|---|---|---|---|---|---|---|---|---|---|---|---|
| 2026 | −11.77%YTD | ||||||||||||
| 2025 | +10.51% | ||||||||||||
| 2024 | +8.80% | ||||||||||||
| 2023 | +20.03% | ||||||||||||
| 2022 | +4.33% | ||||||||||||
| 2021 | +24.12% | ||||||||||||
| 2020 | +14.90% | ||||||||||||
| 2019 | +12.02% | ||||||||||||
| 2018 | +3.15% | ||||||||||||
| 2017 | +28.65% | ||||||||||||
| 2016 | +3.01% | ||||||||||||
| 2015 | −4.06% | ||||||||||||
| 2014 | +31.39% | ||||||||||||
| 2013 | +6.76% | ||||||||||||
| 2012 | +27.70% | ||||||||||||
| 2011 | −24.62% | ||||||||||||
| 2010 | +17.95% | ||||||||||||
| 2009 | +75.76% | ||||||||||||
| 2008 | −51.79% | ||||||||||||
| 2007 | +54.77% | ||||||||||||
| 2006 | +39.83% | ||||||||||||
| 2005 | +36.34% | ||||||||||||
| 2004 | +10.68% | ||||||||||||
| 2003 | +71.90% | ||||||||||||
| 2002 | +3.25% | ||||||||||||
| 2001 | −16.18% | ||||||||||||
| 2000 | −14.75% | ||||||||||||
| Average | −0.39% | −0.45% | −0.39% | +1.83% | +0.78% | +1.45% | +1.76% | +1.16% | +0.93% | +0.80% | +2.72% | +2.50% | +15.17% |
| Median | −0.58% | −0.36% | +0.32% | +1.24% | +0.94% | +1.56% | +2.17% | +0.62% | +0.75% | +1.91% | +3.51% | +1.50% | +11.35% |
| Positive | 10/27 | 13/27 | 14/27 | 16/27 | 14/27 | 18/27 | 19/27 | 16/27 | 15/27 | 17/27 | 16/26 | 17/26 | 21/26 |
What the record shows
- Best year: 2009, +75.76%. Worst year: 2008, −51.79%.
- Strongest calendar month on average: November, +2.72%.
- Weakest calendar month on average: February, −0.45%.
- 185 of 322 months ended higher than they began.
Method
Source: daily open and close levels from NIFTY Indices historical data.
This is the NIFTY 50 price index, which excludes dividends. Returns including dividends would be higher.
A monthly return is the last close of the month divided by the last close of the previous month, minus one. A month appears only once it is complete. Annual returns use the last close of each year in the same way; the current year is shown as YTD to its last complete month.
The base is the open on 3 Jan 2000, the first trading day in the data, at 1,482.15.
Questions
What was the NIFTY 50 return in 2025?
The NIFTY 50 price index returned +10.51% in calendar 2025, measured from the last close of 2024 to the last close of 2025.
What was the NIFTY 50 return in 2024?
The NIFTY 50 price index returned +8.80% in calendar 2024, measured from the last close of 2023 to the last close of 2024.
What is the NIFTY 50 return so far in 2026?
From the last close of 2025 to the end of October 2026, the NIFTY 50 returned −11.77%.
What is the average annual return of the NIFTY 50?
Across 26 full calendar years since 2000, the simple average annual return was +15.17%. Compounded, the index grew at +10.77% a year from its first trading day in 2000, excluding dividends.
How do I calculate the NIFTY 50 return between two dates?
Divide the close on the end date by the close on the start date and subtract one. If a date is a market holiday, use the last trading day before it. For periods of a year or more, the annualised return (CAGR) is the ratio raised to 365.25 divided by the number of days, minus one. The calculator above does this for any two dates.